



Using Public Company and Job-Posting Data as a Signal in Competitive Analytics

Google Analytics separates traffic acquisition by channels and sources, helping teams understand where website sessions originate. Those reports answer a marketing question, but they do not establish whether a competitor is expanding its workforce or preparing a launch. For analysts and business owners, that leaves a gap between online attention and operational momentum.
Public company information offers another layer of evidence. Social Fetch lists company, hiring, post, and advertising endpoints for its LinkedIn scraping API. Treat that service description as a starting point for evaluating coverage, rather than proof of accuracy or permission. Build the workflow around authorized access, consistent observations, and clearly labeled interpretations.
1. Track headcount changes without treating them as payroll
LinkedIn explains that its company insights use member profile information and that calculated employee counts can differ from actual staffing. Its detailed insights also require eligible subscriptions. A publicly visible company size range and a profile-derived employee count should therefore remain separate fields.
For a manageable routine, record available company-level figures monthly. Keep the company identifier, observation date, metric definition, and source together. Compare the same measure across successive snapshots rather than mixing sources halfway through a trend.
If a count rises, describe it as an observed increase in represented employees. Investigate before calling it expansion. Seek confirmation in company announcements or published reports, and avoid collecting individual employee details when aggregate information serves the research purpose.
2. Separate new vacancies from repeated listings
LinkedIn’s Talent Insights documentation says its job data includes directly posted vacancies and listings ingested from company websites, recruitment systems, and other sources. The platform applies deduplication, which illustrates why raw listing totals need careful handling.
Check permitted job sources twice weekly. Record a stable vacancy identifier where available, title, location, department, listing URL, and first observation date. Match these records against the employer’s careers page. Flag reposts and duplicates separately instead of counting every appearance as fresh hiring.
Use role patterns to form questions. Several new engineering vacancies might suggest product investment, while sales roles in another country might suggest market development. These are hypotheses. Keep replacement hiring and ongoing recruitment as alternative explanations until stronger evidence appears.
3. Follow company posts for changes in emphasis
LinkedIn’s posting guidance confirms that company administrators can publish text, images, videos, and documents on their Pages. These provide material for examining what a business chooses to communicate, rather than a complete record of its performance.
Review accessible company posts weekly and group them into practical categories: launches, partnerships, recruitment, events, and customer announcements. Save publication dates and source links. Summarize the relevant message in your own words, with enough context for another analyst to verify it.
Look for sustained changes across several weeks. A repeated focus on a new service is worth investigating. Do not equate posting frequency or visible reactions with commercial success. Make the proposed interpretation explicit and identify what evidence would strengthen or weaken it.
4. Watch advertising activity as messaging evidence
LinkedIn’s Transparency Center provides a searchable Ad Library containing advertisements that have run on the platform. That makes it a source for researching visible campaign messages. An advertisement’s presence alone does not establish spending, profitability, or customer acquisition.
Search selected competitor names weekly, keeping filters consistent. Record available ad identifiers, observation dates, creative themes, calls to action, and destination pages. Distinguish newly observed advertisements from ones already recorded. Use disclosed delivery dates when available rather than assuming observation dates represent campaign starts.
Compare advertising themes with company announcements and vacancies. In a hypothetical example, recruitment for enterprise sales alongside enterprise-focused advertisements could justify closer research into that segment. Present the connection as an analytical inference, with source links attached.
A Step-by-Step Guide to Reviewing Competitive Signals
Start with a small competitor list and one business question, such as whether rivals are emphasizing a particular customer segment. Then assign collection owners, establish the schedules above, and create a shared record with consistent fields.
Each month, review the signals together. Separate observations from interpretations, note missing coverage, and choose a proportionate response. That might mean interviewing customers, examining your positioning, or testing content. Avoid changing strategy because one indicator moved.
Keep freshness and responsibility visible
LinkedIn states that Talent Insights refreshes daily, but that schedule should not be assumed for public pages or third-party services. Record collection timestamps and mark unavailable data as missing, rather than zero.
LinkedIn prohibits unauthorized scraping and automated access. The Information Commissioner’s Office and fellow privacy regulators also warn that publicly accessible personal information remains subject to privacy laws in most jurisdictions. Assess permissions, applicable law, retention, and provider practices before collection.
Finally, combine external company signals with first-party traffic, conversion, and customer feedback. When reviewing your own performance, consider connecting traffic analytics with business goals to keep audience activity tied to measurable outcomes. Use competitive data to decide what to investigate next. Let verified business outcomes guide the eventual decision through regular, documented internal reviews.
Read More









 Video websites and apps are major drivers of traffic and engagement. Companies use video to educate, entertain, and convert customers. At the same time, Accely SAP public cloud expert ishelping businesses modernize their operations with powerful cloud-based ERP solutions.
 JPEG is generally optimal for high-quality headshots with slight gradients, but WebP provides even better compression at the expense of quality. Use PNG only where transparency is crucial since it increases file sizes.


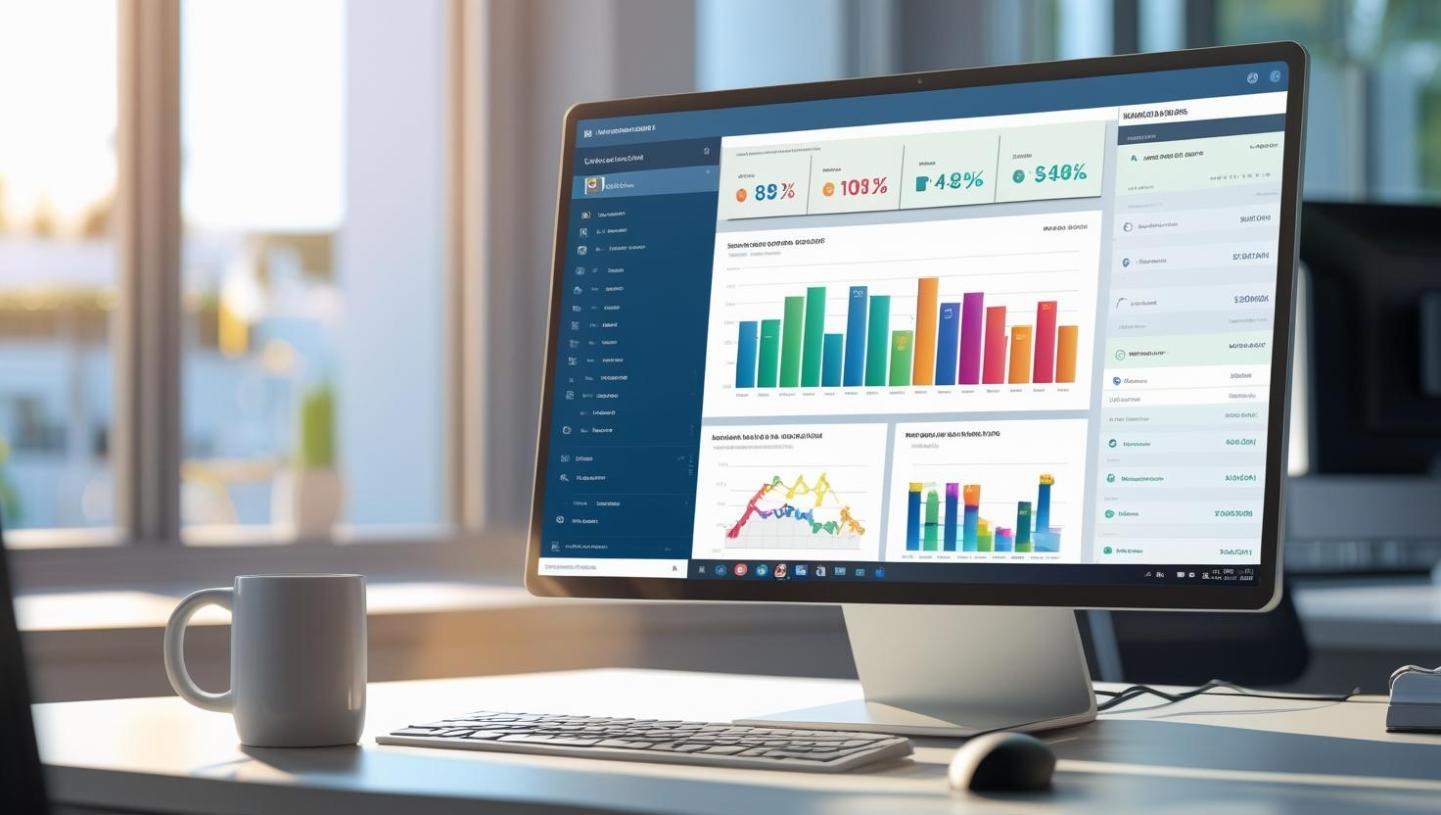
 Understanding your audience is critical to building a successful photography business. Recent studies show that businesses using analytics to track website and app traffic see a 20% improvement in customer engagement. For photographers, this data can provide invaluable insights to refine strategies, improve online presence, and ultimately drive bookings and sales.
 Users of console controller mapping software can alter how their controllers interact with PC games. Customizing control schemes and remapping buttons lets gamers adapt their experience to their tastes.


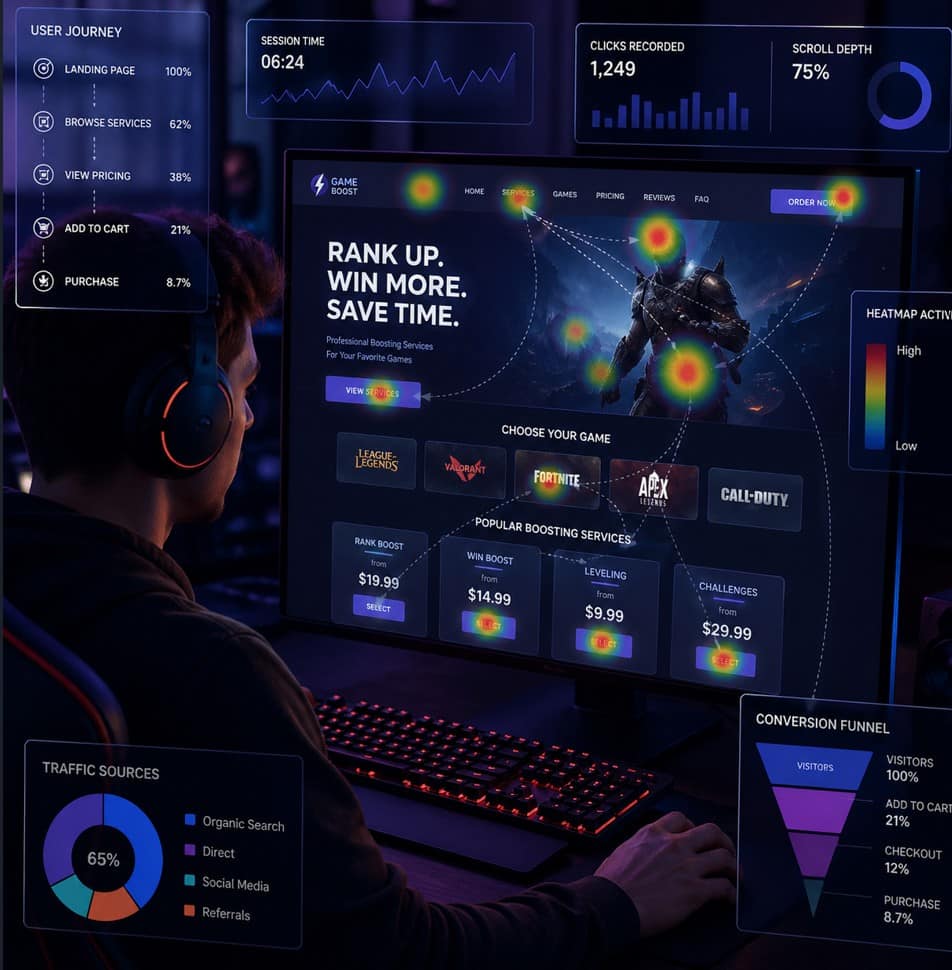
 Growing a website or app requires more than just great content and design; it demands a clear understanding of traffic patterns, user behavior, and the competitive landscape. Domain traffic analytics can provide powerful insights, helping tech and business owners make data-driven decisions to enhance growth. By analyzing which factors drive traffic and which hurdles block it, businesses can fine-tune strategies, attract more visitors, and ultimately achieve their goals.